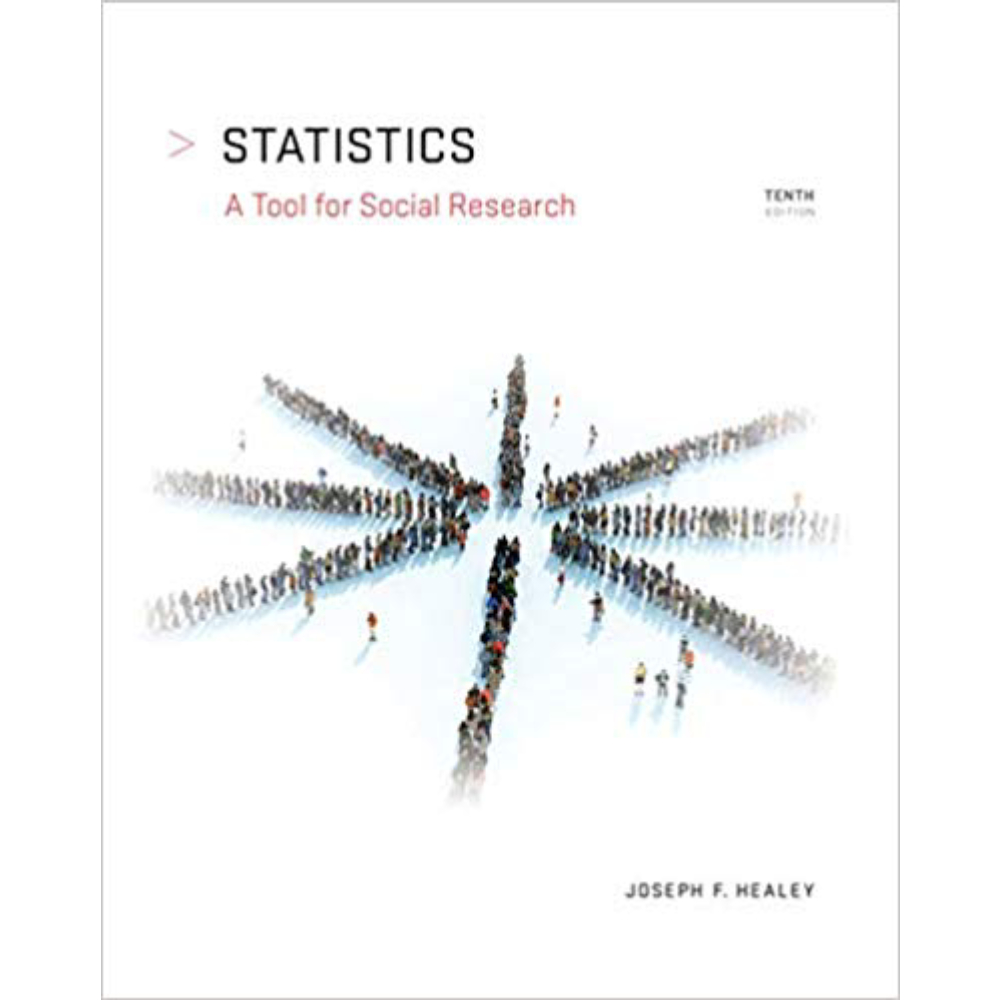
Statistics A Tool For Social Research , 10th Edition By Joseph F. Healey – Test Bank
$55.00
Statistics A Tool For Social Research , 10th Edition By Joseph F. Healey – Test Bank
You will receive this product within 24 hours after placing the order
Statistics A Tool For Social Research , 10th Edition By Joseph F. Healey – Test Bank
1. The popularity of the Chi Square test is largely due to
a. easy computations.
b. the fact that it can be computed only for interval-ratio level variables.
c. the need to assume a normal sampling distribution.
d. the relative ease with which the model assumptions can be satisfied.
ANSWER: d
REFERENCES: 277
LEARNING OBJECTIVES: STAT.HEAL.15.11.01 – Identify and explain examples of situations in which the chi square test is appropriate.
2. The chi square test is frequently used because it is relatively easy to satisfy the model assumptions (step 1 of the five-step model). These assumptions require, in the case of chi square,
a. a normal population distribution.
b. no assumption about the shape of the sampling distribution.
c. expected frequencies of equal value.
d. a difference in expected and observed frequencies.
ANSWER: b
REFERENCES: 277
LEARNING OBJECTIVES: STAT.HEAL.15.11.03 – Explain the logic of hypothesis testing in terms of chi square.
3. Which assumption about level of measurement is made for the Chi square test?
a. All variables are at least ordinal in level of measurement.
b. All variables are at least interval-ratio in level of measurement.
c. All variables are nominal in level of measurement.
d. At least one variable must be ordinal in level of measurement.
ANSWER: c
REFERENCES: 277
LEARNING OBJECTIVES: STAT.HEAL.15.11.03 – Explain the logic of hypothesis testing in terms of chi square.
4. Chi square is one of a class of statistics called
a. nonparametric.
b. parametric.
c. semi-parametric.
d. parametrically symmetrical.
ANSWER: a
REFERENCES: 277
LEARNING OBJECTIVES: STAT.HEAL.15.11.03 – Explain the logic of hypothesis testing in terms of chi square.
5. Unlike other tests of significance, Chi square easily handles situations in which
a. the variables of interest have more than two categories or scores.
b. the variables of interest have less than two categories or scores.
c. variables are all ordinal in level of measurement.
d. degrees of freedom exceed 100.
ANSWER: a
REFERENCES: 277
LEARNING OBJECTIVES: STAT.HEAL.15.11.03 – Explain the logic of hypothesis testing in terms of chi square.
6. To conduct a chi square test, the variables must first be organized into a
a. univariate table.
b. bivariate table.
c. list, which is then ranked.
d. frequency distribution.
ANSWER: b
REFERENCES: 277
LEARNING OBJECTIVES: STAT.HEAL.15.11.02 – Explain the structure of a bivariate table and the concept of independence as applied to expected and observed frequencies in a bivariate table.
7. Unlike other tests of significance, chi square is based on
a. a bivariate table.
b. means as well as proportions.
c. continuous variables only.
d. ordinal-level variables only.
ANSWER: a
REFERENCES: 277
LEARNING OBJECTIVES: STAT.HEAL.15.11.02 – Explain the structure of a bivariate table and the concept of independence as applied to expected and observed frequencies in a bivariate table.
8. A bivariate table in which both variables have three categories has
a. three cells.
b. six cells.
c. nine cells.
d. thirty-three cells.
ANSWER: c
REFERENCES: 277
LEARNING OBJECTIVES: STAT.HEAL.15.11.02 – Explain the structure of a bivariate table and the concept of independence as applied to expected and observed frequencies in a bivariate table.
9. A bivariate table in which one variable had three categories and the other variable had four categories would have
a. four cells.
b. six cells.
c. nine cells.
d. twelve cells.
ANSWER: d
REFERENCES: 277
LEARNING OBJECTIVES: STAT.HEAL.15.11.02 – Explain the structure of a bivariate table and the concept of independence as applied to expected and observed frequencies in a bivariate table.
10. The subtotals calculated for bivariate tables are also known as
a. expected frequencies.
b. marginals.
c. observed frequencies.
d. cells.
ANSWER: b
REFERENCES: 278
LEARNING OBJECTIVES: STAT.HEAL.15.11.02 – Explain the structure of a bivariate table and the concept of independence as applied to expected and observed frequencies in a bivariate table.


Reviews
There are no reviews yet.